Data · 5,950 posts · 16 to 23 September 2026
A week of Jev, sorted
What 5,950 posts from 4,593 authors built with Jev in its first week, where the attention went, how much of it was measured, and whether any of it was new.
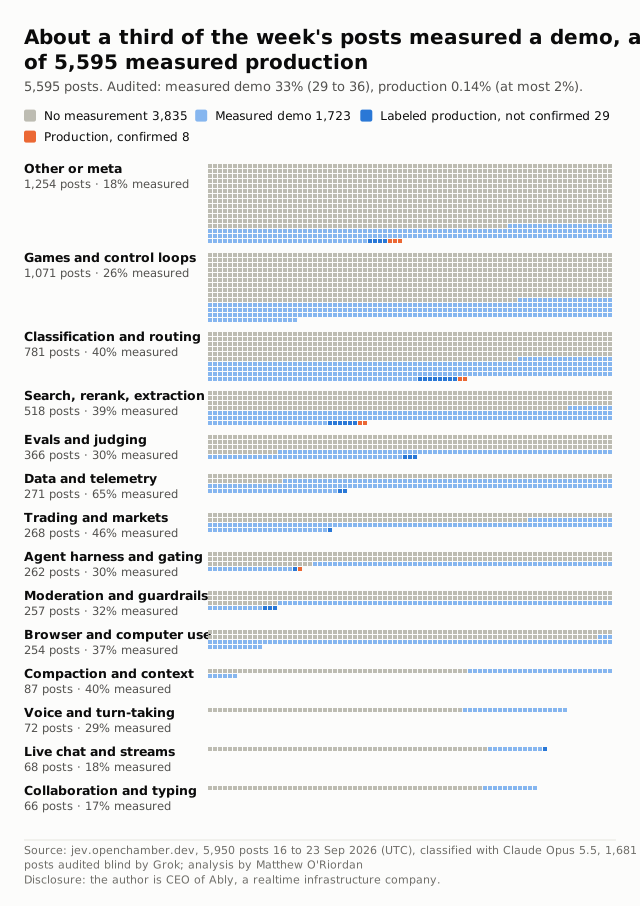
Every post that uses Jev, on the measurement ladder (figure 1):
- no measurement3,835
- measured demo1,723
- labeled production, not confirmed29
- production, confirmed8
Jev, TypeSafe AI's typed-decision model, launched on 15 September, the first of a new category that everyone got excited about at once. It doesn't write prose: it answers typed questions about a state (pick one of these, score this, yes or no), and it answers fast.
I went looking for where it applies to realtime, the part of the stack I spend my days on, so I sorted every post in OpenChamber's Jev feed from that first week. Wherever a blind audit of 1,681 posts checked a number, I give its range, not a model's count.
The short version
- None of the 91 builds most likely to show something new did something that was unavailable before: a team would have used an LLM for 64 of them (figure 1c).
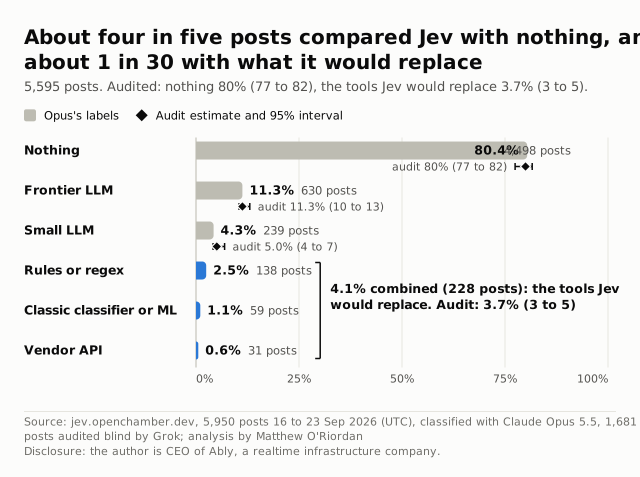
- About four in five posts compare Jev with nothing, 80% (77 to 82), and about 1 in 30 with the tools it would replace, 3.7% (3 to 5).
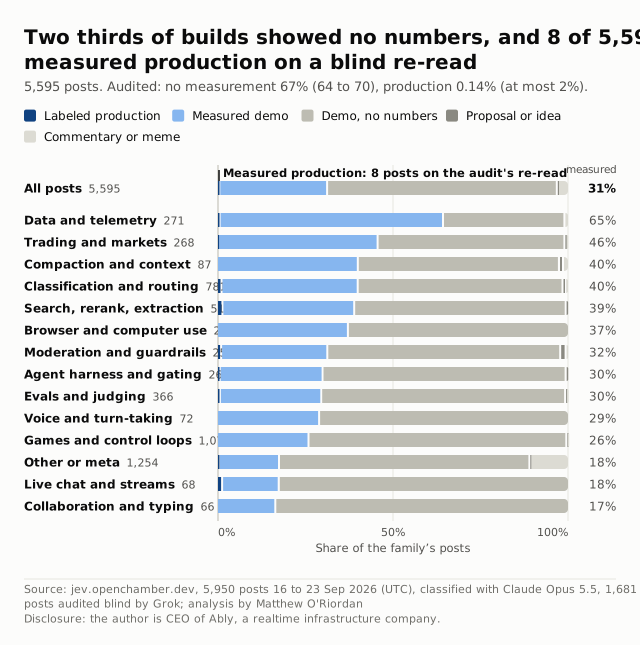
- Eight of 5,595 posts measured Jev in production, 0.14% (at most 2%), and none of them is a realtime build.
- When Jev was surest it agreed with Opus 98.0% of the time, and it labeled every post for $0.33 against $29.26 for Opus.
Figure 1
The week in one picture
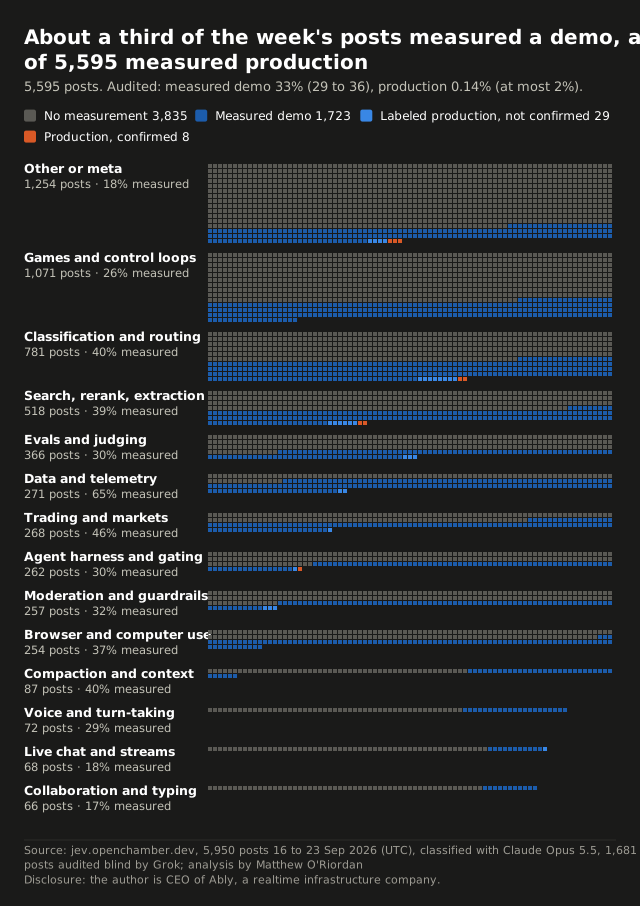
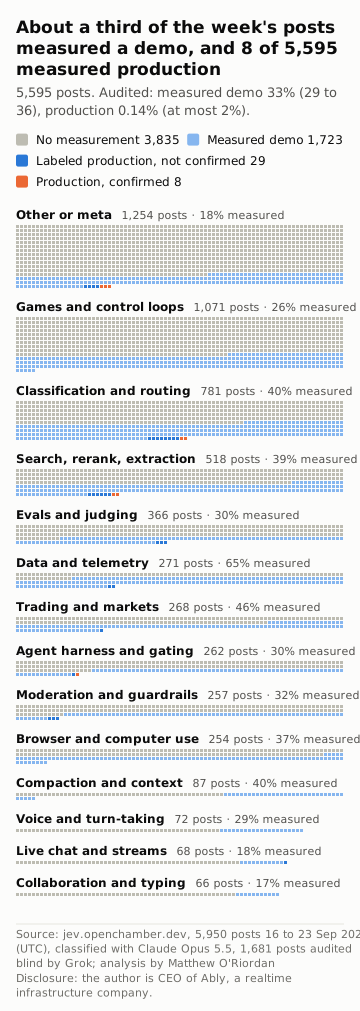
Two thirds of the posts measured nothing, 67% (64 to 70) on the audit, and about a third reported a number from the author's own run, 33% (29 to 36). Production is only the 8 orange squares, the posts that held when the audit re-read them: 0.14% of posts, and at most 2%.

Show the numbers
| Family | No measurement | Measured demo | Labeled production, not confirmed | Production, confirmed | Posts |
|---|---|---|---|---|---|
| Other or meta | 1,032 | 215 | 4 | 3 | 1,254 |
| Games and control loops | 791 | 280 | 0 | 0 | 1,071 |
| Classification and routing | 467 | 304 | 8 | 2 | 781 |
| Search, rerank, extraction | 315 | 195 | 6 | 2 | 518 |
| Evals and judging | 257 | 106 | 3 | 0 | 366 |
| Data and telemetry | 96 | 173 | 2 | 0 | 271 |
| Trading and markets | 145 | 122 | 1 | 0 | 268 |
| Agent harness and gating | 183 | 77 | 1 | 1 | 262 |
| Moderation and guardrails | 176 | 78 | 3 | 0 | 257 |
| Browser and computer use | 159 | 95 | 0 | 0 | 254 |
| Compaction and context | 52 | 35 | 0 | 0 | 87 |
| Voice and turn-taking | 51 | 21 | 0 | 0 | 72 |
| Live chat and streams | 56 | 11 | 1 | 0 | 68 |
| Collaboration and typing | 55 | 11 | 0 | 0 | 66 |
| All posts | 3,835 (68.5%) | 1,723 (30.8%) | 29 (0.5%) | 8 (0.1%) | 5,595 |
Figure 1b
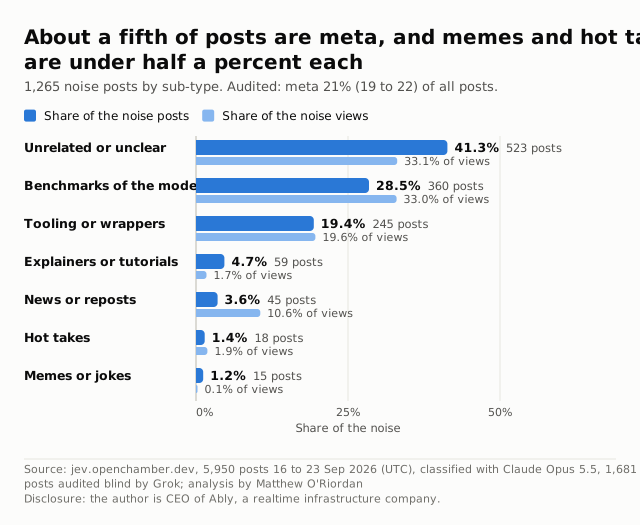
What the noise is made of
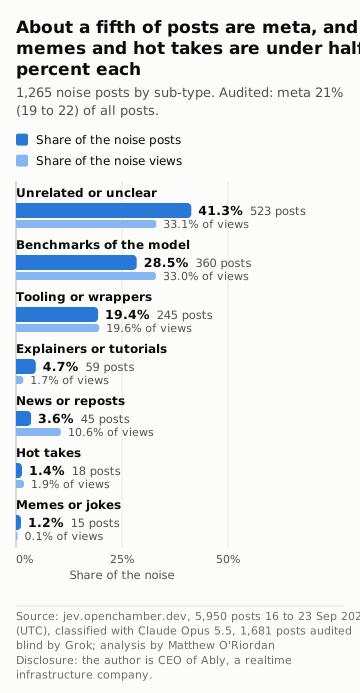
About a fifth of posts state no use case, benchmark the model itself or wrap it: 21% (19 to 22) on the audit. Of the 1,265 noise posts, 89% are unrelated or unclear posts, benchmarks of the model and tooling or wrappers, and memes and hot takes are under half a percent of all posts each.
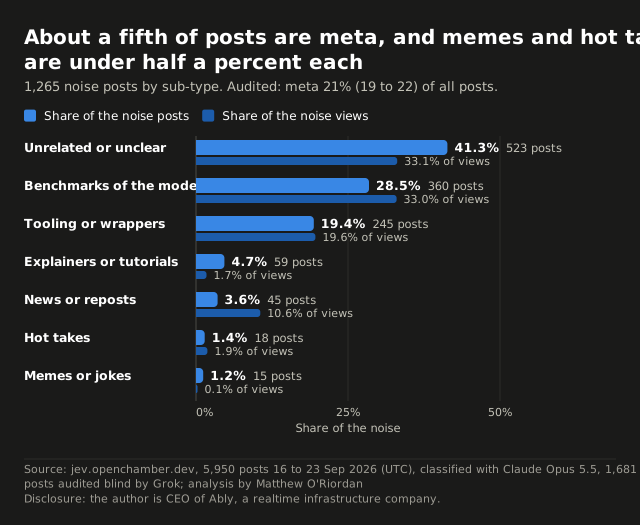

Show the numbers
| Sub-type | Posts | Share of noise | Share of all posts | Share of noise views | Median views | Most-viewed post (views) |
|---|---|---|---|---|---|---|
| Unrelated or unclear | 523 | 41.3% | 9.3% | 33.1% | 137 | LLM built from 29 yes/no questions per character with Jev (158,692) |
| Benchmarks of the model | 360 | 28.5% | 6.4% | 33.0% | 66 | Word-choice interface for Jev to generate text (649,221) |
| Tooling or wrappers | 245 | 19.4% | 4.4% | 19.6% | 116 | Probabilistic programming language powered by Jev (774,848) |
| Explainers or tutorials | 59 | 4.7% | 1.1% | 1.7% | 114 | Dice game demo about calibrated probabilities (28,802) |
| News or reposts | 45 | 3.6% | 0.8% | 10.6% | 123 | Typed decision API for app state on Venice (527,680) |
| Hot takes | 18 | 1.4% | 0.3% | 1.9% | 137 | SEO/geo audit and fix agent cut costs 30x (58,987) |
| Memes or jokes | 15 | 1.2% | 0.3% | 0.1% | 123 | Tiny town website with Jev in the tallest tower (2,167) |
| All noise | 1,265 | 100% | 22.6% | 100% | 111 | Probabilistic programming language powered by Jev (774,848) |
| Hot takes, bullish | 6 | |||||
| Hot takes, skeptical | 7 | |||||
| Hot takes, mixed | 4 | |||||
| Hot takes, neutral | 1 |
Figure 1c
What would have done the job before?
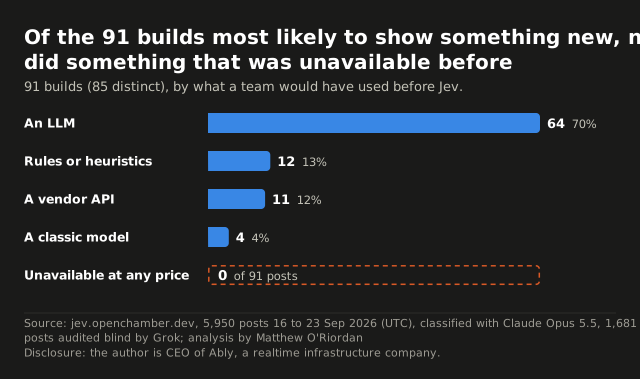
None of the 91 builds most likely to show something new, the posts labeled as a measured decision made while a person waits, did something that was unavailable before: a team would have used an LLM for 64, rules for 12, a vendor API for 11 and a classic model for 4. The audit judged each one from its post, not by running the build.
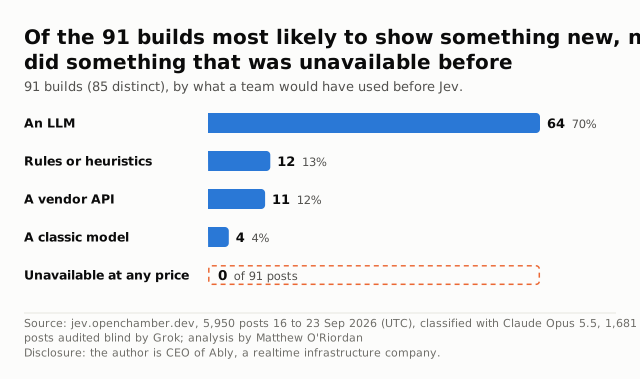

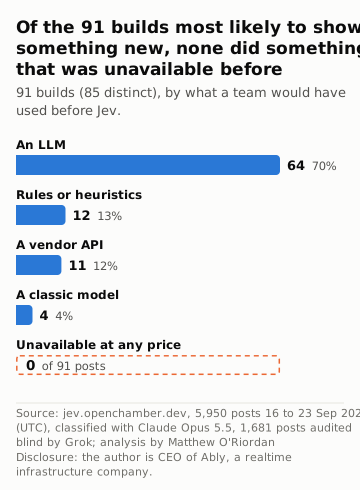
Show the numbers
| What would have done the job before | Posts | Share of the candidates |
|---|---|---|
| An LLM | 64 | 70% |
| Rules or heuristics | 12 | 13% |
| A vendor API | 11 | 12% |
| A classic model | 4 | 4% |
| Unavailable at any price | 0 | 0% |
| Distinct builds among them | 85 | |
| Job: feed or comment filters | 22 | 24% |
| Job: typing or form fill | 13 | 14% |
| Job: voice commands | 13 | 14% |
| Job: triage | 6 | 7% |
| Job: voice turn-taking | 6 | 7% |
| Job: guards | 5 | 5% |
| Job: speech scoring | 5 | 5% |
| Job: trading decisions | 5 | 5% |
| Job: classification | 3 | 3% |
| Job: computer use | 3 | 3% |
| Job: games or simulations | 3 | 3% |
| Job: alerts | 2 | 2% |
| Job: live control | 2 | 2% |
| Job: search | 2 | 2% |
| Job: personal tools | 1 | 1% |
Figure 2
Half the views went to 1 percent of posts
The top 1% of posts, 56 of them, hold 53.3% of the 44.6 million views and 47.0% of the likes, and the median post has 133 views. The most-viewed post alone is 7.8% of views, with a like rate far below the median, but without the 9 posts like it the top 1% still hold 49.8%.
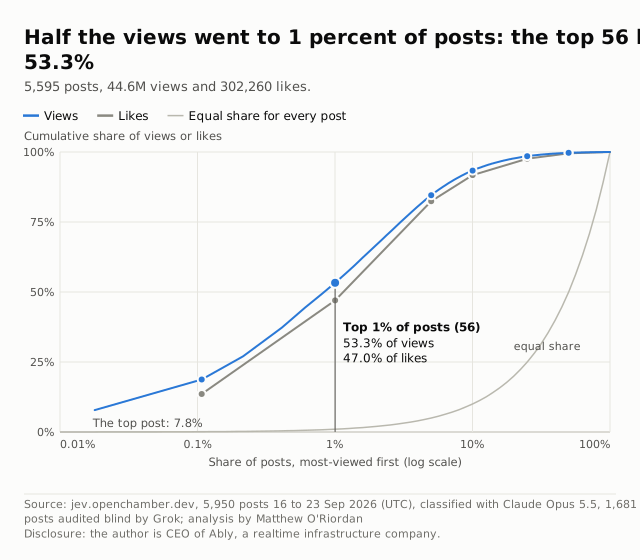
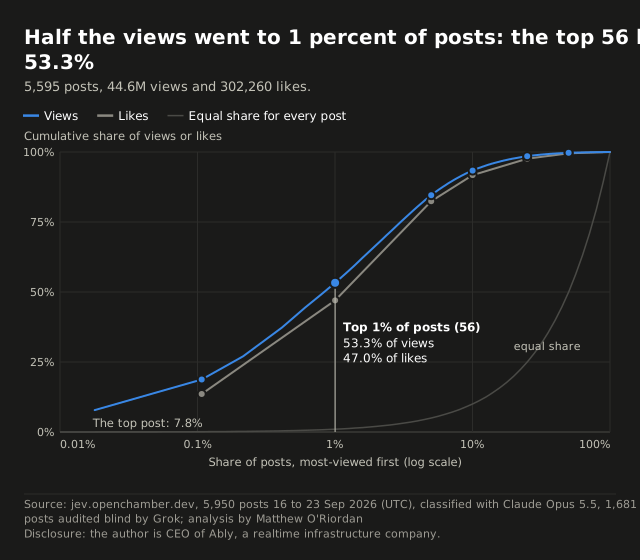

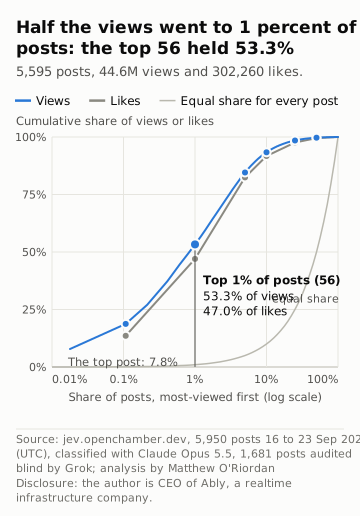
Figure 3
What did they compare against?
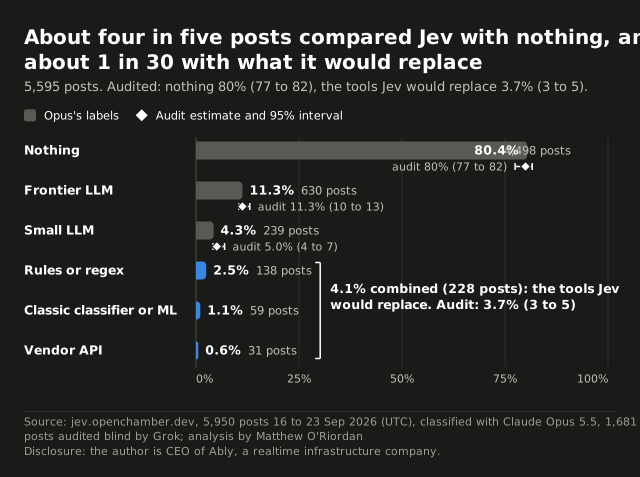
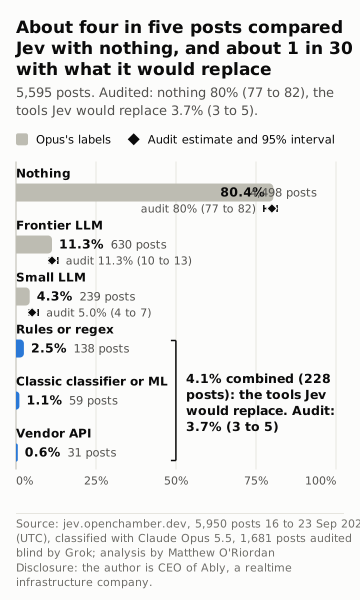
About four in five posts compare Jev with nothing, 80% (77 to 82) on the audit, and about 1 in 30 with the classifiers, rules and vendor APIs it would replace, 3.7% (3 to 5). A week of "28× cheaper", and almost nobody asking "than what I already had?"

Show the numbers
| Baseline | Posts | Share of posts | Share of views | Audit estimate (95% interval) |
|---|---|---|---|---|
| Nothing | 4,498 | 80.4% | 74.9% | 80% (77 to 82) |
| Frontier LLM | 630 | 11.3% | 14.3% | 11.3% (10 to 13) |
| Small LLM | 239 | 4.3% | 6.9% | 5.0% (4 to 7) |
| Rules or regex | 138 | 2.5% | 2.2% | |
| Classic classifier or ML | 59 | 1.1% | 0.5% | |
| Vendor API | 31 | 0.6% | 1.3% | |
| The tools Jev would replace (the last three) | 228 | 4.1% | 3.7% (3 to 5) |
Figure 4
Claims without numbers
By family, data and telemetry measured most often, 65% of its posts, and collaboration and typing least, 17%. Only eight posts measured Jev in production on the audit's re-read: a task router deployed "for a real production use case", a deploy approval gate, a news pipeline, a search reranker, an episode recommender, a fleet-wide decision layer, and two public Q&A sites, AskJev.ai and AskJev.net, that counted their questions and visitors.
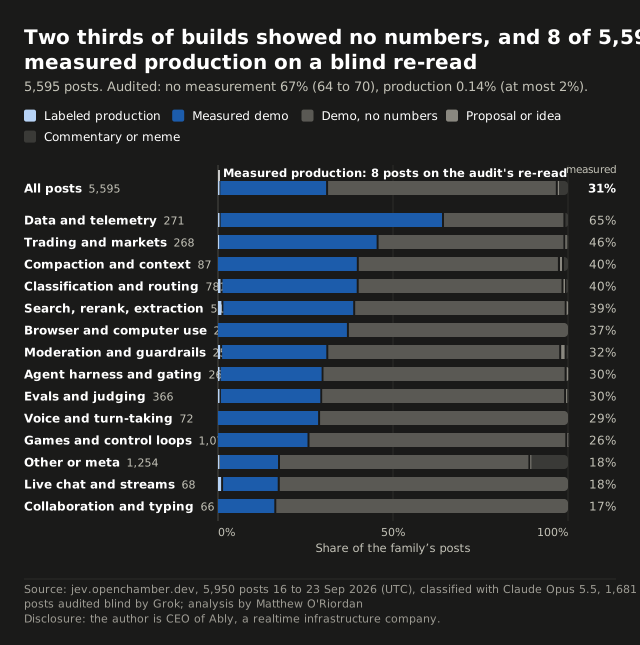

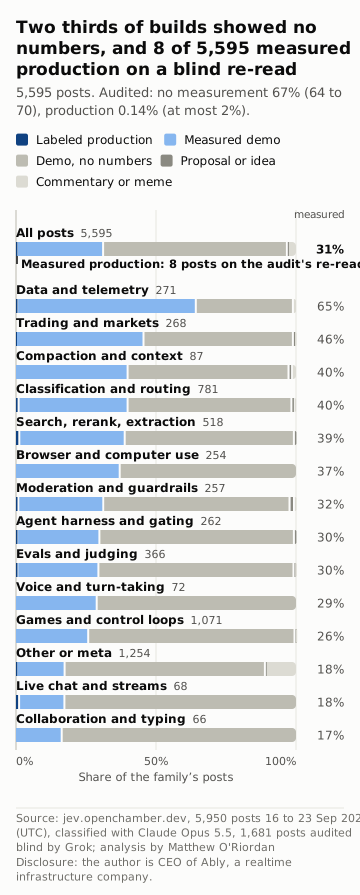
Show the numbers
| Family | Labeled production | Measured demo | Demo, no numbers | Proposal or idea | Commentary or meme | Measured share |
|---|---|---|---|---|---|---|
| All posts | 37 | 1,723 | 3,672 | 21 | 142 | 31.5% |
| Data and telemetry | 2 | 173 | 94 | 0 | 2 | 64.6% |
| Trading and markets | 1 | 122 | 143 | 1 | 1 | 45.9% |
| Compaction and context | 0 | 35 | 50 | 1 | 1 | 40.2% |
| Classification and routing | 10 | 304 | 457 | 6 | 4 | 40.2% |
| Search, rerank, extraction | 8 | 195 | 313 | 2 | 0 | 39.2% |
| Browser and computer use | 0 | 95 | 159 | 0 | 0 | 37.4% |
| Moderation and guardrails | 3 | 78 | 171 | 4 | 1 | 31.5% |
| Agent harness and gating | 2 | 77 | 182 | 1 | 0 | 30.2% |
| Evals and judging | 3 | 106 | 255 | 1 | 1 | 29.8% |
| Voice and turn-taking | 0 | 21 | 51 | 0 | 0 | 29.2% |
| Games and control loops | 0 | 280 | 789 | 1 | 1 | 26.1% |
| Other or meta | 7 | 215 | 897 | 4 | 131 | 17.7% |
| Live chat and streams | 1 | 11 | 56 | 0 | 0 | 17.6% |
| Collaboration and typing | 0 | 11 | 55 | 0 | 0 | 16.7% |
Figure 5
What people claimed
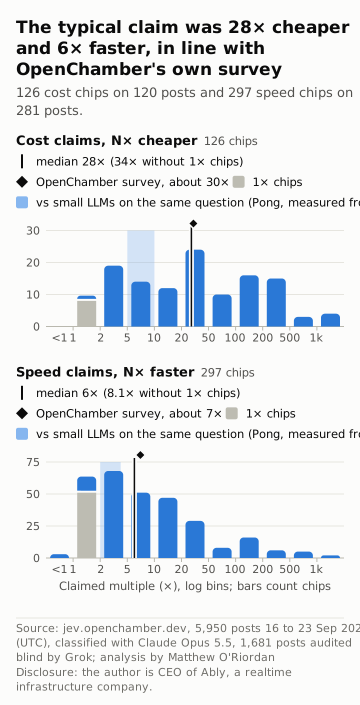
The median claim on the cards was 28× cheaper and 6× faster, close to OpenChamber's own survey of user reports at about 30× and 7×. These are the authors' numbers, and figure 3 shows what most of them are measured against: nothing named at all, or a frontier model.
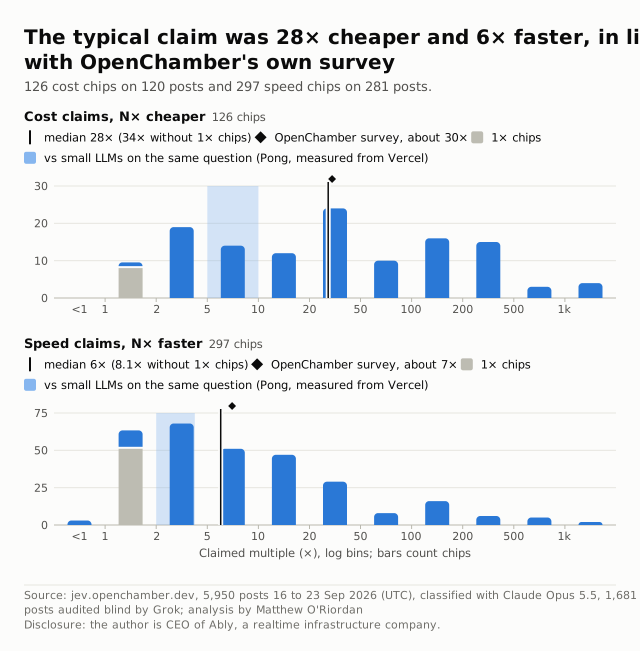
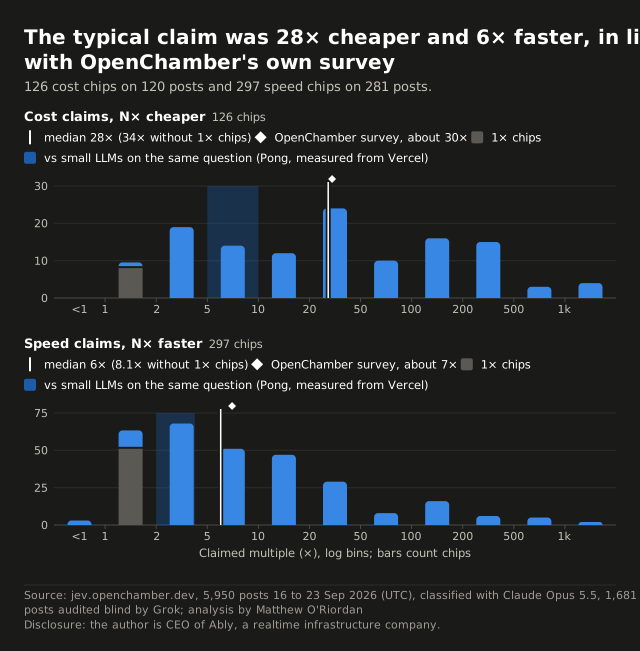

Show the numbers
| Claimed multiple | Cost claims, N× cheaper (chips) | Speed claims, N× faster (chips) |
|---|---|---|
| under 1× | 0 | 3 |
| 1× to under 2× | 9 (8 read exactly 1×) | 62 (51 read exactly 1×) |
| 2× to under 5× | 19 | 68 |
| 5× to under 10× | 14 | 51 |
| 10× to under 20× | 12 | 47 |
| 20× to under 50× | 24 | 29 |
| 50× to under 100× | 10 | 8 |
| 100× to under 200× | 16 | 16 |
| 200× to under 500× | 15 | 6 |
| 500× to under 1,000× | 3 | 5 |
| 1,000× to more | 4 | 2 |
| Median | 28× (34× without 1×) | 6× (8.1× without 1×) |
| Middle half | 5.25× to 100× | 2× to 16× |
Figure 6
Who needs it fast
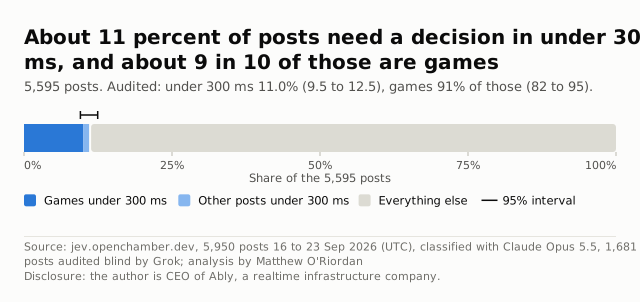
On the audit, about 11% of posts need a decision in under 300 ms, and about nine in ten of those are games. Jev's own median call took 412 ms from a laptop, above every one of those budgets.

Show the numbers
| Audited estimate | Estimate | 95% interval | From |
|---|---|---|---|
| Posts that need a decision in under 300 ms | 11.0% | 9.5% to 12.5% | 76 of 150 re-read posts still under 300 ms, plus 91 that only Opus puts there |
| The same, on the audit's samples alone | 10.3% | 8.2% to 14.3% | neither model's word |
| Games, among those posts | 90.8% | 82.2% to 95.5% | 69 of 76 |
Figure 7
The realtime slice
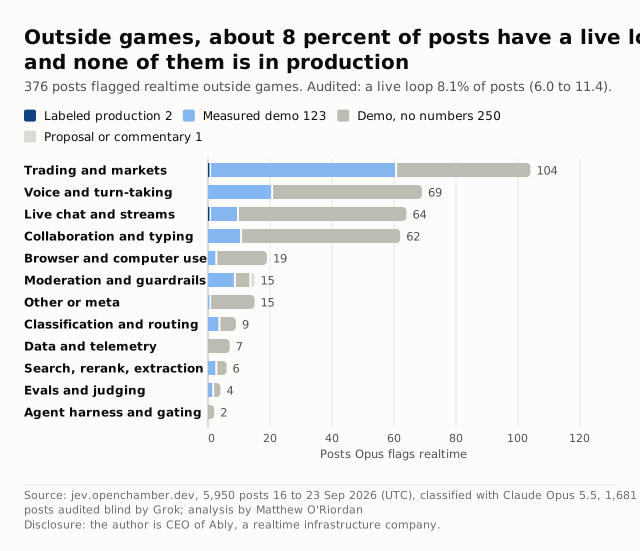
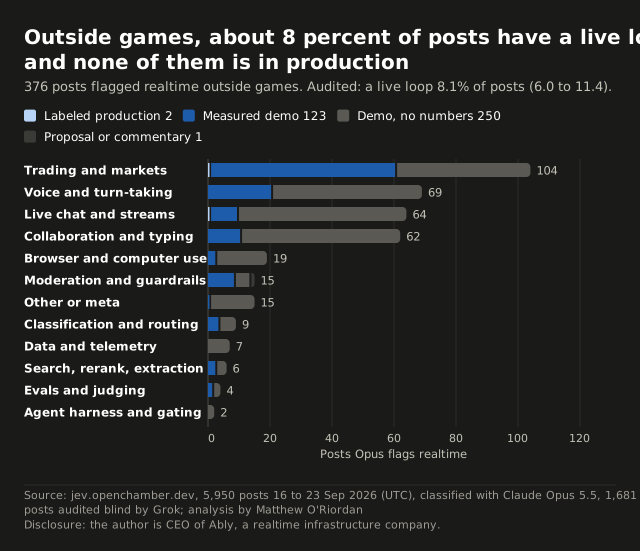
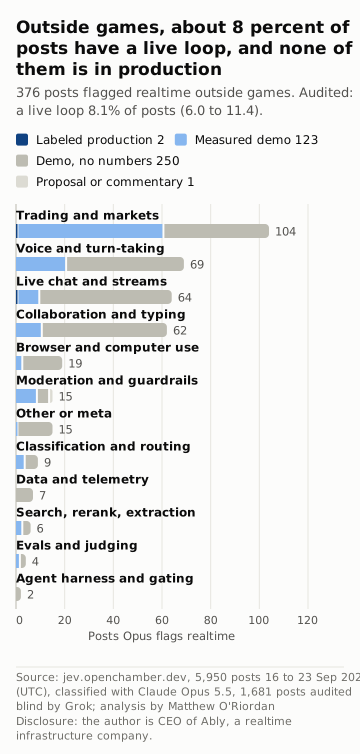
Outside games, a live loop is 8.1% of posts on the audit (6.0 to 11.4), and none of the eight posts that measured production is a realtime build. The best realtime demos, a voice turn-end detector at 0.224 s and a predictive spreadsheet that scores rows as you type, are faster versions of jobs a vendor API and an LLM already did.

Show the numbers
| Family | Labeled production | Measured demo | Demo, no numbers | Proposal or commentary | Flagged realtime |
|---|---|---|---|---|---|
| Trading and markets | 1 | 60 | 43 | 0 | 104 |
| Voice and turn-taking | 0 | 21 | 48 | 0 | 69 |
| Live chat and streams | 1 | 9 | 54 | 0 | 64 |
| Collaboration and typing | 0 | 11 | 51 | 0 | 62 |
| Browser and computer use | 0 | 3 | 16 | 0 | 19 |
| Moderation and guardrails | 0 | 9 | 5 | 1 | 15 |
| Other or meta | 0 | 1 | 14 | 0 | 15 |
| Classification and routing | 0 | 4 | 5 | 0 | 9 |
| Data and telemetry | 0 | 0 | 7 | 0 | 7 |
| Search, rerank, extraction | 0 | 3 | 3 | 0 | 6 |
| Evals and judging | 0 | 2 | 2 | 0 | 4 |
| Agent harness and gating | 0 | 0 | 2 | 0 | 2 |
| All outside games | 2 | 123 | 250 | 1 | 376 |
Figure 8
What measuring buys
Measuring buys the hits, not the typical post: measured demos averaged 12,755 views against 5,752 for demos with no numbers, but the median barely moves, 143 against 130. Most posts got little attention either way: 45% had under 100 views.
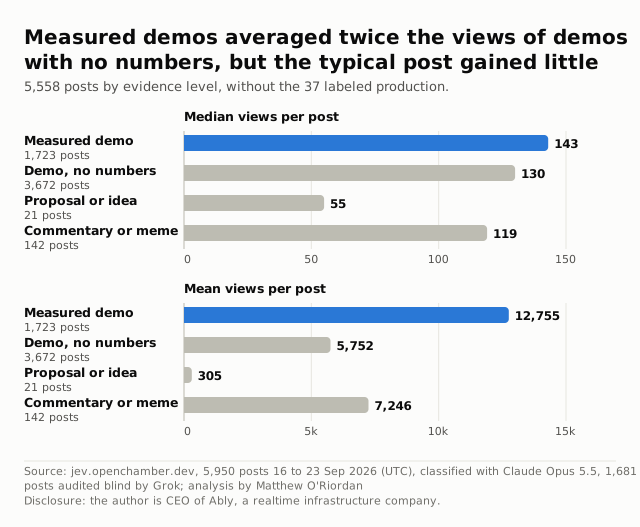
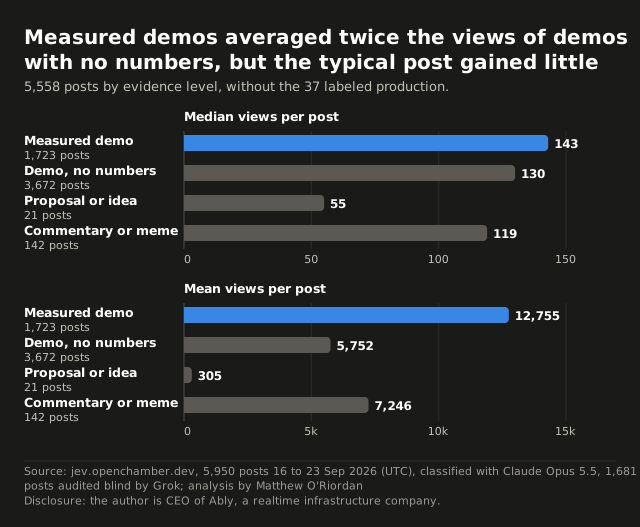

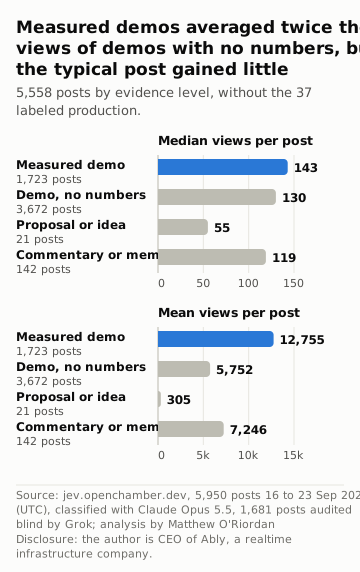
Figure 9
Jev grading Jev
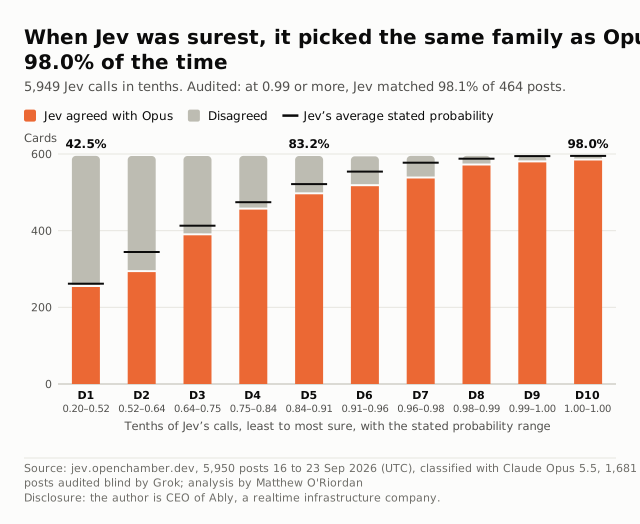
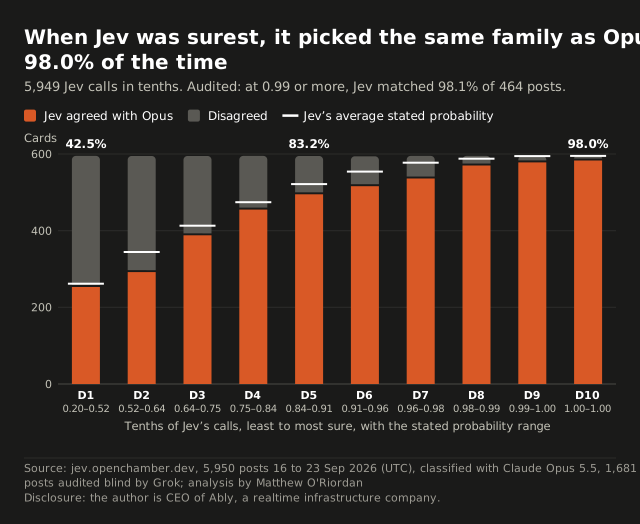
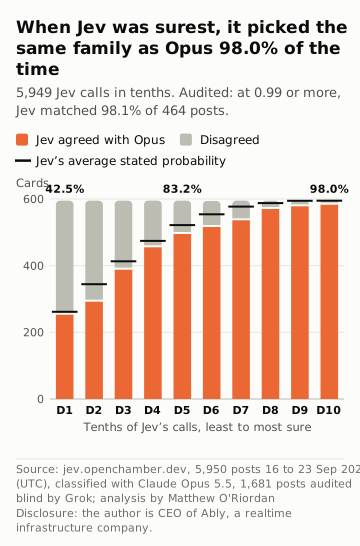
When Jev was surest it picked Opus's family 98.0% of the time, against 42.5% when it was least sure, and it labeled every post for $0.33 against $29.26 for Opus: a cheap model that knows when it's sure can sit in front of a slower one. That's agreement, not accuracy, but on the 464 audited posts where Jev said 0.99 or more, it matched the audit's family 98.1% of the time.

Show the numbers
| Tenth | Cards | Stated probability | Mean stated | Agreement with Claude Opus 5.5 |
|---|---|---|---|---|
| D1 | 595 | 0.20 to 0.52 | 0.440 | 42.5% |
| D2 | 595 | 0.52 to 0.64 | 0.579 | 49.1% |
| D3 | 595 | 0.64 to 0.75 | 0.694 | 65.2% |
| D4 | 595 | 0.75 to 0.84 | 0.797 | 76.5% |
| D5 | 595 | 0.84 to 0.91 | 0.877 | 83.2% |
| D6 | 594 | 0.91 to 0.96 | 0.933 | 86.9% |
| D7 | 595 | 0.96 to 0.98 | 0.970 | 90.1% |
| D8 | 595 | 0.98 to 0.99 | 0.988 | 95.8% |
| D9 | 595 | 0.99 to 1.00 | 0.999 | 97.1% |
| D10 | 595 | 1.00 to 1.00 | 1.000 | 98.0% |
Figure 10
Where the builders were
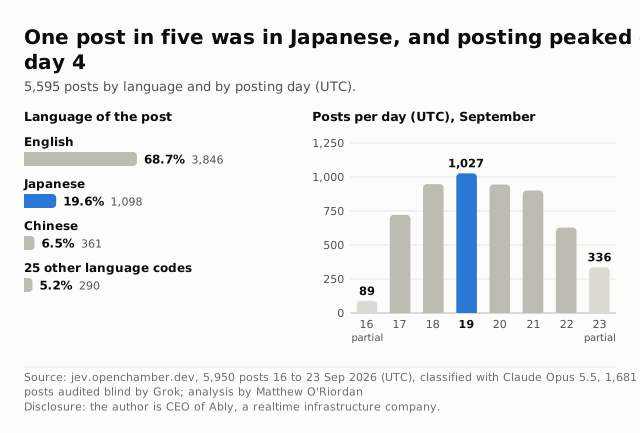
Japanese builders wrote 20% of all posts but 32% to 36% of the live chat, voice and collaboration posts, the families I care about most. The feed starts at 00:28 UTC on the 16th, about six hours after launch, so the first evening is missing.

Show the numbers
| Language or day | Posts | Share of posts |
|---|---|---|
| English | 3,846 | 68.7% |
| Japanese | 1,098 | 19.6% |
| Chinese | 361 | 6.5% |
| 25 other language codes | 290 | 5.2% |
| 2026-09-16 (partial) | 89 | 1.6% |
| 2026-09-17 | 721 | 12.9% |
| 2026-09-18 | 948 | 16.9% |
| 2026-09-19 | 1,027 | 18.4% |
| 2026-09-20 | 945 | 16.9% |
| 2026-09-21 | 901 | 16.1% |
| 2026-09-22 | 628 | 11.2% |
| 2026-09-23 (partial) | 336 | 6.0% |
Method
How this was measured
The posts come from OpenChamber's Jev feed, snapshot 23 September 18:47 UTC: 5,950 posts from 4,593 authors between 16 and 23 September, as OpenChamber selected them. Without 7 duplicates, the 347 posts that don't use Jev and the one post Opus refused to label, 5,595 remain.
A written rubric sorted each post into one of fourteen families by what Jev decides, and labeled what it measured, what it compared Jev with and whether it needs realtime infrastructure.
Claude Sonnet 5 labeled every post first. A critical review of those labels tightened the rubric, and Sonnet labeled every post again. Then Grok, an independent model, labeled 1,681 posts blind: every post in the rare groups the headlines rest on, and random samples of the rest. Sonnet agreed with it on what a post is for only 71% of the time, so Claude Opus 5.5 labeled every post a final time; it agrees 82% of the time, and the charts use its labels.
That's why the headlines come with ranges: the audit read samples, so each share it checked is an estimate with a 95% interval, and the page uses it, not the labels' count.
Two fields are dropped. Framing, what a post leads with, misrepresented the many posts that lead with cost and latency together, and the seven-level latency tier agrees with the audit least (75%), so figure 6 keeps only the split at 300 ms.
I labeled 13 posts myself as a calibration, too few to check the models but enough to find both problems: I disagreed with both models on the tier of 8.
At Vercel AI Gateway list prices the labeling cost $47.53: $16.47 for the two Sonnet passes, $29.26 for Opus, $1.47 to sort the noise and $0.33 for Jev.
The labels, tables, rubric and code are at github.com/mattheworiordan/jev-landscape, without the text of any post: code under MIT, data and method under CC BY 4.0. This page and its charts are © 2026 Matthew O'Riordan; the posts belong to their authors.
Disclosure. I'm CEO of Ably, a realtime infrastructure company.
Show the audit tables
The audit
A piece about unmeasured claims should show its own measurements being checked. An independent reviewer, Grok, labeled 1,681 posts against the same rubric without seeing the model's labels: all 422 posts in the rare groups the headlines rest on, and seeded random samples of 100 to 300 posts from the rest. Each sample is scaled up to its group with a 95% Wilson interval. The review is published with every label and the scripts that turn them into the numbers on this page. The audit sampled from the Sonnet 5 labels. Because the charts use Opus's, I reran its estimators with Opus as the model being checked (the rerun): the audit's labels stay the reference, shares are of Opus's 5,595 posts, and where the audit didn't sample, Opus's labels fill in, with the count stated.
It tested ten of the claims I'd published: 4 hold, 3 hold with a correction and 3 fail. The failures are why this page no longer sorts posts into buckets. "Cost-only" (23.3% of posts) was the bin every other measured post fell into, and its description fits about 12.5% (9.8 to 16.6). And not one of the 91 "materially different" builds did something that was unavailable before. The other two fails, the share of posts that compare Jev with nothing and the share that are meta, rest on the audit taking the labels as right wherever it didn't sample. On its own random samples, the Sonnet 5 labels' 81.4% and 21.1% sit inside the intervals (77 to 85, and 16 to 25). That's why the audited numbers on this page are ranges.
What was checked
| Group | How | Posts in the group | Audited |
|---|---|---|---|
| Measured production (Sonnet label) | every post | 15 | 15 |
| The 91 candidate builds | every post | 91 | 91 |
| Voice, live chat or collaboration | every post | 156 | 156 |
| Classic ML, rules or vendor baseline | every post | 201 | 201 |
| No comparison named | random sample | 4,647 | 300 |
| Demo, no numbers | random sample | 3,681 | 200 |
| Measured demo | random sample | 1,928 | 200 |
| Not a realtime family, not games | random sample | 4,475 | 200 |
| Realtime flag false | random sample | 3,971 | 200 |
| Realtime flag true, not games | random sample | 720 | 100 |
| Other or meta | random sample | 1,203 | 150 |
| Under 300 ms (frame, feel or turn) | random sample | 1,064 | 150 |
| Unique posts audited | 1,681 (422 in the census groups) |
How often the audit agrees with the model
The share of audited posts where the audit's label matches the Claude Opus 5.5 label, field by field. The groups aren't a random sample of the week, so the last row is agreement on the audited posts, not on every post.
| Group | Posts | Family | Tier | Evidence | Baseline | Realtime | Production |
|---|---|---|---|---|---|---|---|
| Measured production (Sonnet label) | 15 | 87% | 73% | 80% | 93% | 100% | 93% |
| The 91 candidate builds | 91 | 84% | 75% | 89% | 92% | 88% | 99% |
| Voice, live chat or collaboration | 156 | 79% | 75% | 97% | 97% | 93% | 99% |
| Classic ML, rules or vendor baseline | 201 | 82% | 69% | 95% | 79% | 97% | 99% |
| No comparison named | 300 | 82% | 75% | 93% | 96% | 96% | 98% |
| Demo, no numbers | 200 | 82% | 71% | 92% | 98% | 92% | 98% |
| Measured demo | 200 | 84% | 73% | 94% | 93% | 96% | 100% |
| Not a realtime family, not games | 200 | 82% | 80% | 91% | 96% | 97% | 98% |
| Realtime flag false | 200 | 76% | 80% | 95% | 92% | 98% | 98% |
| Realtime flag true, not games | 100 | 83% | 78% | 95% | 94% | 90% | 96% |
| Other or meta | 150 | 79% | 83% | 89% | 95% | 97% | 99% |
| Under 300 ms (frame, feel or turn) | 150 | 93% | 72% | 97% | 97% | 89% | 99% |
| All audited cards | 1,681 | 82% | 75% | 93% | 94% | 95% | 98% |
The Claude Sonnet 5 labels the audit sampled from agree less on every field:
| Field | Sonnet 5 (first labels) | Opus 5.5 (this page) |
|---|---|---|
| Family | 71% (κ 0.67) | 82% (κ 0.79) |
| Tier | 62% (κ 0.52) | 75% (κ 0.69) |
| Evidence | 89% (κ 0.79) | 93% (κ 0.86) |
| Baseline | 89% (κ 0.73) | 94% (κ 0.83) |
| Realtime | 86% (κ 0.67) | 95% (κ 0.86) |
| Production | 98% (κ 0.52) | 98% (κ 0.64) |
The ten claims
As first published, with the audit's corrected value and its 95% interval.
| # | Claim | Published | Audit on Sonnet | Verdict | Audit on Opus | Verdict on Opus |
|---|---|---|---|---|---|---|
| 1 | Comparison baselines | 81.5% compare Jev with nothing, 11.9% with a frontier LLM, 3.0% with a small LLM, 3.6% with the thing Jev would replace | 78.2% nothing, 13.5% frontier LLM, 4.8% small LLM, 3.5% the tools Jev would replace; 75.7–79.8%; 12.8–15.3%; 3.9–6.6%; 2.8–5.1% | Fails | 80.0% (77.4–81.6%); 11.3% (10.5–13.1%); 5.0% (4.2–6.9%); 3.7% (3.0–5.4%) | Holds |
| 2 | Production with numbers | at most 1.6%; 0.9% on a re-read; 0.3% on the strict label | 0.14% (8 of 15 strict cards hold); 0.14–2.0% | Holds with correction | 0.14% (0.14–2.01%) | Holds with correction |
| 3 | The bucket scheme | about 38% demos with no numbers; about 12% hype; about 23% cost-only; 1.6% (90 posts) materially different, 87 outside games | the demo and hype rules rest on the framing field, since withdrawn; 12.5% of posts fit the cost-only description, not 23.3%; 38 of the 91 still meet the material test (0.67%; 2.0% with misses), and none did something unavailable before; 9.8–16.6% cost-only; 1.2–4.6% material | Fails | no measurement 67.3% (63.5–70.5%); measured demo 32.5% (29.4–36.3%); demos, no numbers (chip rule) 46.6% (41.8–51.6%); claim, no number (chip rule) 2.5% (1.3–5.4%); cost-only as described 12.5% (9.7–16.6%); material test 2.0% (1.2–4.6%) | The ladder shares hold |
| 4 | Voice, live chat and collaboration | 2.8% of posts, none in production | 3.8% of posts; 0 in production; 0 claiming production; 2.7–6.3% | Holds with correction | 4.0% (2.9–6.6%); 0 in measured production | Holds |
| 5 | A live loop | about a fifth of posts; 5 to 10 percent outside games | 7.8% outside games; about a fifth with games (21.7%); 5.8–11.1% outside games | Holds | outside games 8.1% (6.0–11.4%); all 22.4% | Holds |
| 6 | Decisions under 300 ms | of posts that need a decision in under 300 ms, about 91% are games | 90.8% are games; the set is 9.4% of posts, not 19%; 82.2–95.5% games; 8.0–10.9% of posts | Holds | set 11.0% (9.5–12.5%); games 90.8% (82.2–95.5%) | Holds; the set's size does not |
| 7 | Posts that never say what Jev decides | a fifth never say what Jev decides, or are benchmarks or wrappers; memes and hot takes about 1% each | 14.9% stay meta; 12.4% vague, a benchmark or a wrapper; memes 0.28%, hot takes 0.42%; 13.3–16.3% still meta | Fails | meta 20.9% (19.4–22.2%); memes 0.29%; hot takes 0.44% | Holds with correction: the fifth holds on the audit-only estimate; memes and hot takes are under half a percent each |
| 8 | Attention | half of all views sit on 1% of posts | the top 1% (58 posts) hold 53.4% of views; 49.6% without the 9 suspect posts; 47.5% of likes; a census, no sampling | Holds with correction | top 1% (56 posts) hold 53.3% of views; 49.8% without the suspect posts | Holds with correction |
| 9 | Jev as a classifier | Jev agreed with the model on 77% of cards, and was right 27 of 28 times at 0.99 or more | 76.7% (4,561 of 5,943); 27 of 28; 98.1% on the audit's 464 cards at 0.99 or more; a census of Jev's calls | Holds | Jev = Opus 78.4%; 97.0% at 0.99 | Holds |
| 10 | The claimed multiples | the median claim is about 28× cheaper and 6× faster | 28× cheaper (126 chips), 6× faster (299 chips); 34× and 8.5× without the 1× chips; a census of the chips | Holds | 28x cheaper (126 chips), 6x faster (297 chips) | Holds |
The numbers this page uses
Each audited estimate with its 95% interval, as a share of Opus's 5,595 posts. "Samples only" uses the audit's random samples where it didn't look, instead of Opus's labels. The last column is the audit's own estimate on the Sonnet 5 labels.
| Posts that | Audited | Samples only | Opus labels | Audit on Sonnet 5 |
|---|---|---|---|---|
| Compare Jev with nothing | 80.0% (77.4 to 81.6) | 80.7% (76.8 to 84.8) | 80.4% | 78.2% (75.7 to 79.8) |
| Compare it with a frontier LLM | 11.3% (10.5 to 13.1) | 10.3% (6.9 to 14.2) | 11.3% | 13.5% (12.8 to 15.3) |
| Compare it with a small LLM | 5.0% (4.2 to 6.9) | 5.3% (2.9 to 9.9) | 4.3% | 4.8% (3.9 to 6.6) |
| Compare it with the tools it would replace | 3.7% (3.0 to 5.4) | 3.7% (2.9 to 7.3) | 4.1% | 3.5% (2.8 to 5.1) |
| Measured nothing | 67.3% (63.5 to 70.5) | 68.5% | 67.2% (63.4 to 70.3) | |
| Demo with no numbers | 46.6% (41.8 to 51.6) | 47.9% | 46.5% (41.6 to 51.4) | |
| A cost, speed or accuracy claim with no number | 2.5% (1.3 to 5.4) | 2.1% | 2.4% (1.2 to 5.3) | |
| Measured demo | 32.5% (29.4 to 36.3) | 30.8% | 32.7% (29.6 to 36.5) | |
| Measured production | 0.14% (0.14 to 2.01) | 0.66% | 0.14% (0.14 to 1.99) | |
| Voice, live chat or collaboration | 4.0% (2.9 to 6.6) | 3.9% (2.7 to 7.9) | 3.7% | 3.8% (2.7 to 6.3) |
| A live loop outside games | 8.1% (6.0 to 11.4) | 8.3% (5.9 to 13.3) | 6.7% | 7.8% (5.8 to 11.1) |
| Need a decision in under 300 ms | 11.0% (9.5 to 12.5) | 10.3% (8.2 to 14.3) | 14.5% | 9.4% (8.0 to 10.9) |
| Games, of those under 300 ms | 90.8% (82.2 to 95.5) | 88.1% | 87.4% | 90.8% (82.2 to 95.5) |
| Meta (no use case, a benchmark or a wrapper) | 20.9% (19.4 to 22.2) | 20.7% (16.9 to 25.9) | 22.4% | 14.9% (13.3 to 16.3) |
What the audit couldn't check
The audit drew its groups on the Sonnet 5 labels, so for Opus's labels some groups are thin: it read only part of the posts Opus puts in voice, live chat and collaboration, for example. The 847 posts the Sonnet 5 labels say compare Jev with a frontier or small LLM weren't sampled, so those estimates take Opus's word there. The posts from those groups the audit happened to label for other reasons agree 115 of 151 and 27 of 40 with the Sonnet 5 labels, and that slice isn't a random sample. The audit re-read the 15 posts the Sonnet 5 labels called production; its first-pass labels call three more posts production, which its count leaves out (Opus calls all three production too), and the 2% upper end allows for posts like those. The first review's re-read of the first pass's 95 production posts wasn't repeated. Games were left out of the check for missed voice, live chat and collaboration posts. The 78 proposal and commentary posts stayed on the model's label. The feed cuts post text at 400 characters and a claim chip can invent a number: 48 of the 1,023 posts the audit calls demos with no numbers still carry a numeric chip. And the auditor is another AI model, not a person. I labeled 13 posts myself, enough to drop two labels but not enough to check the rest, so human labels are still the missing check.
How the posts were labeled
- Data. OpenChamber's Jev feed, snapshot 23 September 18:47 UTC: 5,950 posts from 4,593 authors, which OpenChamber selected with its own filter for what counts as a build. That includes 6 posts an earlier snapshot held and the feed later dropped. Post times decoded from the X ids run from 16 September 00:28 to 23 September 18:44 UTC. Views are X impressions and likes are X likes, both as the feed recorded them.
- Open data. The labels from every model and the audit, the tables behind every chart, the rubric and the code are at github.com/mattheworiordan/jev-landscape. The feed's post text isn't republished there; the repo says how to fetch it.
- Rubric. The v2 rubric has 15 families (the fourteen on the charts, and one for posts that don't use Jev), 7 latency tiers, 5 evidence levels, 5 framings, 6 baselines, and two flags: realtime infrastructure and a production claim. The framings and the seven tiers were labeled but aren't charted; they are in the labels file. "Measured" needs a number from the author's own run; TypeSafe's launch numbers quoted as Jev's general speed or price don't count. "Unclear" is allowed and preferred to a guess.
- Models. Claude Opus 5.5, with adaptive thinking, labeled every post through Vercel AI Gateway, in batches of 40, with the v2 rubric as a cached system prompt (
data/classified-opus.jsonl). Its safety filter refused one post, which is left out. Claude Sonnet 5 made the first two passes, and its v2 labels are the ones the audit sampled from. The Gateway ignores temperature for both models, so both runs were sampled at its default and aren't deterministic: on the same 120 cards, two Sonnet runs matched on family for 102 of 120. Jev classified the family of every post again as a second classifier, one call per post. - Noise sub-types. A separate Claude Sonnet 5 pass sorted the noise posts (Other or meta, or commentary in another family) into sub-types, and the hot takes by stance, against
report/rubric-noise.md. - Cost. At Gateway list prices the first Sonnet pass cost $7.71 and the second $8.76 ($8.39 for the full run and the refreshes, $0.37 for two 120-card pilots). The Claude Opus 5.5 run cost $29.26. Sorting the noise into sub-types (figure 1b) cost $1.47, and Jev's pass $0.33.
- Base. 7 duplicate posts were merged, and the 347 posts that don't use Jev (5.8%: local clones, distillations, Jev-compatible APIs over other models, builds on other models) are left out of every use-case chart, as is the post Opus refused. That leaves 5,595 posts.
- Agreement. The audit is the main check: Grok labeled 1,681 posts blind, and agrees with Opus on family for 82% of them, on evidence for 93% and on tier for 75%. An earlier check, 120 random posts labeled blind by Claude Opus 5.5 in a separate run, is in the report. I labeled 13 posts myself as a calibration. The readers that checked every number are AI models; a proper human sample is the check still missing.
What the charts count
- Figure 1. No measurement: a demo with no numbers, a claim with no number, a proposal or commentary. Measured demo: a number from the author's own run. Production: a number from a live system. The audit re-read every post the Sonnet 5 labels called production and 8 hold. Opus labels those 8 production too, but of all the posts it labels production the audit read 20 and agrees with only 11, so the count here is the audit's. The other seven posts the audit re-read are tests, a figure measured in development, or a claim with no number from the live system. The first labeling pass said 1.6% (95 posts), and its own re-read kept 51, a looser reading the audit did not repeat.
- Figure 1b. Noise is a post in Other or meta, or commentary in another family. Unrelated or unclear: not about Jev, or the author's own app or demo where the post doesn't say what Jev decides. Benchmarks: tests of Jev itself with no application. Tooling: SDKs, clients, ports and infrastructure for calling Jev. On the audit's re-read memes are 0.29% of posts and hot takes 0.44%, and of the 18 hot takes 6 are bullish, 7 skeptical, 4 mixed and 1 neutral. The label moves both ways: the audit re-read 150 of the posts the Sonnet 5 labels call meta and moved 44 of them to a real use, most often classification, and it also found meta posts among the ones the labels gave a use. When I labeled posts myself, I gave a real use to all four that both models call meta, so a careful human reader would likely put the share lower.
- Figure 1c. The 91 are every post the Sonnet 5 labels called a measured decision inside a live system, made while a person waits (100 ms to 1 s), and compared with nothing, rules, classic ML or a frontier LLM. On the audit's own labels 38 of them still meet that test, and 6 are a second post about a build already counted. The largest jobs: feed or comment filters (22), typing or form fill (13) and voice commands (13).
- Figure 2. Views are X impressions and likes are X likes, as the feed recorded them, unverified. The top post is 7.8% of views at a like rate of 0.06%, against a median of 0.76% for posts with 1,000 or more views; without it the top 1% hold 49.7%. Posts from 16 to 19 September are 50% of posts and hold 79% of views: older posts had longer to collect them. The audit recounted these on the 5,709 posts it sampled from and got 53.4% and 49.6%.
- Figure 3. A comparison counts only when it is named or clearly implied, such as "replaced my keyword filter" (rules) or a before-and-after figure. The frontier and small-LLM groups weren't sampled, so their estimates rest on Opus's labels there. All four of Opus's shares are inside the audit's intervals.
- Figure 4. Bars are Opus's evidence labels by family, sorted by the share that measured anything. The darkest segment is Opus's production label, which the audit doesn't support: of the posts it labels production, the audit read 20 and agrees with 11.
- Figure 5. The feed extracts the claim chips from the full post. The "1×" chips (8 cost, 51 speed) are an extractor artifact; without them the medians are 34× and 8.1×. Accuracy and latency chips aren't charted: they mix Jev's numbers with the baseline's and with Jev's stated confidence.
- Figure 6. Under 300 ms is the frame, feel or turn tier. The rubric puts ordinary game input in the feel tier, so part of the games share is built in. Opus's own count, 14.5%, is outside the audit's interval. Jev's p95 call took 654 ms.
- Figure 7. Bars are Opus's realtime flags. Sonnet 5's flags were generous (the audit kept 51 of the 100 it re-read); Opus's 6.7% sits inside the audit's interval. Opus labels two posts in this slice measured production: the audit re-read one, a live news feed, and it didn't hold; it never saw the other, a launch-alert model for trading. Voice, live chat and collaboration are 4.0% of posts on the audit (2.9 to 6.6), with none measured in production and two claiming it without a number, a live news feed and a Discord moderation bot. With games, a live loop is about a fifth of all posts (22.4%).
- Figure 8. Views favor older posts. The posts Opus labels measured production are left out: the audit confirms 8 production posts in all. This chart replaces one of views by what a post leads with, the framing field that is dropped.
- Figure 9. Each column is one tenth of Jev's 5,949 calls, ranked by the probability Jev stated for its answer; Jev chose among the first pass's 14 families. Overall it picked Opus's family for 78.4% of cards (kappa 0.75), and 38% of its calls at 0.99 or above are games or trading, the easiest families. On 120 cards labeled blind by Claude Opus 5.5 in a separate run, not by people, Jev is right on 27 of 28 of its calls at 0.99 or above.
- Figure 10. The feed's first post is at 00:28 UTC on 16 Sep and the last at 18:44 UTC on 23 Sep, so both are partial days.
The buckets are gone
The first versions of this page put every post in one of six buckets: noise, hype, demo, cost-only, fast loop and material. The rules were finished after the data arrived, and the audit showed they didn't hold (claim 3), so the buckets are withdrawn. The measurement ladder in figure 1 and the substance test in figure 1c replace them. The bucket tables are kept for the record in the repo (report/v1/buckets-on-v2-labels.md), and so is the Sonnet version of this analysis (report/v2/).
What changed from the first pass
A critical review of the first pass found that "hype" rested on Sonnet calling any build "capability", that the accuracy and latency chip medians mixed Jev's numbers with baselines, and that "5,782 people" was 5,782 posts from 4,469 authors. The v2 rubric moved measured production from 1.6% to 0.2% of posts and production claims from 4.7% to 1.8%. The realtime flag went the other way (25.8% to 29.8%) because v2 flags nearly every game; figure 7 corrects for that with the audit.
Data quality and limits
- Post text in the feed is capped at 400 characters, and 983 posts (17%) are cut. The claim chips come from the full post, so some numbers are visible only as chips.
- The most-viewed post has a like rate of 0.06%, and 9 posts with 100,000 or more views and a like rate under 0.2% hold 12.4% of views. Figure 2 gives the numbers without them.
- Every label is one model's reading of a short post, not a check of what was built. Claims on the cards are the authors' own and aren't reproduced here.
- Every table behind these charts, the rubric and the scripts are in the repo; this page and its charts are generated from those CSVs by
report/site/scripts/charts.mjs.